In the last few years, we've heard a lot about the growth of measuring stats and analytics at the NHL level.
Terms like Corsi and Fenwick are thrown around like hot potatoes to determine which players bring the best ROI (return on interest) for their ice time and overall value to their teams.
After all, every team's goal is to win the Stanley Cup and how harmful would it be to have that slight edge over others.
Think of the analytics like counting cards in BlackJack - when the math is in your favour, you're eventually going to come out a winner, right?
However, I'm not here to analyze these confusing metrics, but simply to see if there's been a change one particular stat - the shot count.
So let's begin by answering the question you came for...
What is the average number of shots in an NHL game?
The average number of shots per game was 63 (or 31.5 per team) during the 2018-19 NHL season. The league saw a total 80,054 shots throughout the entire regular season (shootouts excluded). The top individual shooters for the season were Nathan MacKinnon (365 shots), followed by Patrick Kane (341) and Alex Ovechkin (338).
When comparing these shot totals to the average of the past decade (source), we begin to see a slight increase.
Normally, the range lied precisely between 58-61, but has averaged higher in the last three seasons (including 2019-20 so far).
There have been many changes made to NHL rules and with the emergence of hockey metrics, I wouldn't be able to pinpoint where exactly the increase comes from.
I could speculate that the icing rule change has had an effect.
Not only are players not allowed to change on the icing, but the offensive team can choose which circle to take the draw on the face-off.
So not only are the defensive teams deprived from playing their best centre man, but the offensive almost certainly will.
As a result, more offensive draw wins will lead to more shots on net. Again, that's just my assumption in the shot upsurge.
Perhaps an analysis of which shots have increased might paint a better. I'll keep that in mind for future blogs. The good thing is that these stats are readily available on the official NHL site.
Another topic that comes when looking up the NHL average shots per game, is the record for most shots in an NHL game by a team.
Most Shots in an NHL Game by a Single Team
The record for most shots in a game is 92 by the Montreal Maroons against the Detroit Red Wings back in March 24, 1936. This is actually before the NHL tracked the shots on net statistic, therefore making it the unofficial record.
Officially, the most shots on net was just set by the Tampa Bay Lightning against the Columbus Blue Jackets in August 11, 2020 - that number is 88 shots on goal.
For a full breakdown of NHL shot records, make sure to check out my blog post about Most Shots in an NHL game.
How does the NHL count shots?
Although I was able to name 15 different shots NHL players use in a game (see my blog post here), the NHL officially reports only 7 types.
And they are the: wrist shot, slap shot, deflection, tip-in, wrap around, backhand and snap shot.
As I've argued before, you can label every shot type under these categories, however you'd be doing a disservice in describing them all that way.
Let me give you 2 examples:
First, the Lacrosse goals by Andrei Svechnikov.
Technically, these goals can be described as wrap arounds, but they were considerably more creative than that.
Wrap arounds don't make great "goal of the year" candidates, but the Lacrosse move certainly will.
And second, the Sidney Crosby "baseball swat" goals. In this case, the NHL labels them as tip-ins, but we know that there was more to it than a simple redirection.
In the end, the league can create an infinite amount of data points, but maybe the fine details are not worth making the stats more complicated.
So what makes for a real effective shot an the NHL level? Does speed matter all that much?
We're going to look now at some shooting stats so we can better determine the dangerous aspects of shots in hockey.
Who had the hardest shot?
In 2019, the NHL's hardest shot belonged to John Carlson with a speed of 102.8 mph. He accomplished this feat in the 2019 All-Star Game's Hardest Shot Competition. As a note, the NHL doesn't provide analytics for every single event in a game.
So there's no way of knowing the speed of all 80,000+ shots on net for the season.
By the way, the official hardest shot was set by Zdeno Chara back in 2012 All-Star Game - clocked at 108.5 mph.
Those are definitely considered very powerful shots. In fact, anything over 100mph is eye popping generally. But does it make you a better goal scorer?
How effective are slap shots in a game?
If I was asked who's the king of slap shots in NHL, typically 2 names come to mind: Alex Ovechkin and Shea Weber.
Ovechkin because of all the one-timer goals he scores on the powerplay and his potential to surpass Wayne Gretzky in career goals.
And Weber because of the brute power of his shot - 106.5 mph (2020 All-Star Game).
So those are prime examples of players with great slappers.
When you look at the stats, slap shots account for just under 10% of all goals. They're similar in number to both backhand and tip-in goals.
However, the success rate of slap shots compared to all other shot types paints an unfavourable picture.
Players connected on only 6.3% of all slap shots.
As expected, slap shots have the most chance of success between the blue line and high circles, but still only accounted for 730 of the 7,500+ goals scored throughout the season.
Overall, slap shots are still effective at the NHL level, but they are only one of many tools a player should possess in their arsenal.
Which leads us to the next question...
Which shot is the most dangerous?
There are many angles by which you can approach this question. If you were to ask me, the wrist shot is the most dangerous simply because most goals are scored this way (51.8% of all goals).
However, when you measure the goals scored against the total wrist shot attempts, it amounts to only an 8.9% success rate.
For a goalie, the shot they have most trouble saving is the tip-in. Tip-ins had a success rate of 17.1% in the 2018-19 season.
That percentage is close to double that of wrist shots, however they much less frequently executed.
I've included a graph on Goals Scored vs Success Rate below.
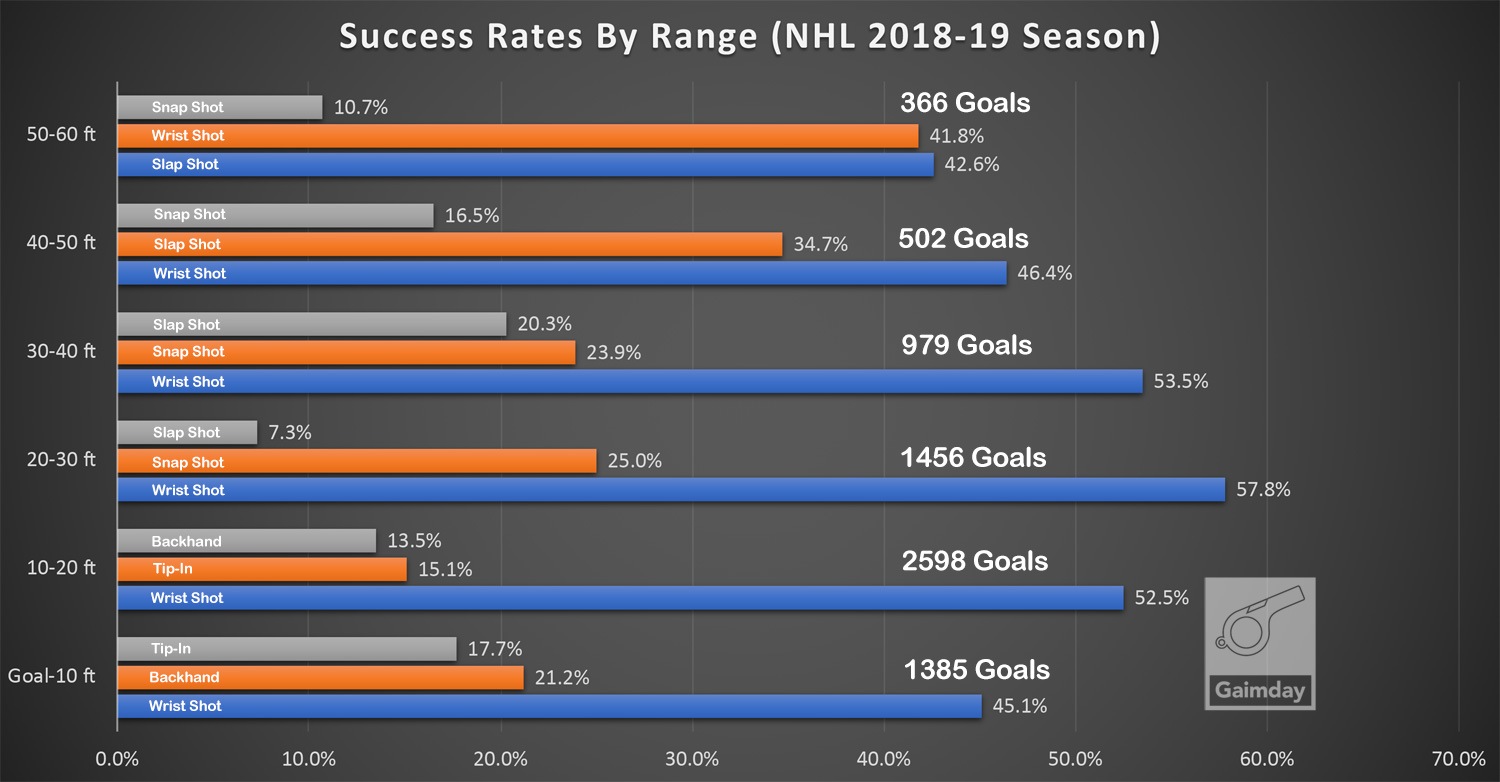
If you want to read more on How Most NHL Goals are Scored, make sure to check out my blog post here. The frequency of snap shot goals is nothing close to what I'd expect.
How many shots get blocked?
With all this talk about shots, have you ever wondered how many shots never make it to the net?
I'm not speaking of shots that go wide, but rather shots that are blocked by courageous players.
It turns out that for every 2 successful shots on net, just about 1 shot will have been blocked.
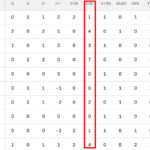
That is, the NHL saw 36,265 blocked shots (source) led by Andy Greene of the New Jersey Devils (208).
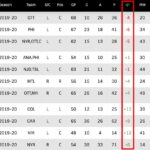
It's hard to for me to gauge the overall effectiveness of Greene's shot blocking abilities, since he was -9 (+/-) for a Devils team that stood no chance of making the playoffs anyway.
In addition, I haven't watched enough Devils games to comment on his overall defensive talent.
However, the New York Islanders recently acquired him through trade (February 26, 2020) for their eventual playoff run.
He's definitely no scoring powerhouse, however his shot blocking ability does provide some of the sandpaper teams need to make it deep in the playoffs.
So, now that we've taken a deep look at shooting in the NHL, you're probably curious about how many goals were scored per game this year. Also, has scoring gone up with the surge in analytics?
Let's dive right in...
Average Number of Goals per Game
The goals-per-game average for the 2018-19 NHL Season was 5.96. At the end of the year, the number of goals reached an all time high with 7,577.
This count shatters the previous record set for "goals for" in 2005-06 (7,443).
As a note, I removed the "goals for" awarded for shootout victories.
If you weren't aware, the NHL rules state that the shootout winner is credited an additional goal to their GF column totals, while the losing team gets dinged with 1 goal against (GA column).
Which team scored the most goals?
The Tampa Bay Lightning scored 325 goals for, the most of any team in the NHL.
Along with this realization, the team finished with the best NHL record (62-16-4) and were led by Nikita Kucherov's 128 points (NHL 2018-19 best).
Despite the team's accomplishments, what's most shocking is that they were swept in the first round of playoffs by the Columbus Blue Jackets.
As the old adage goes, the playoffs are a whole new season and regular season records mean nothing.
Which team allowed the most goals against?
The Ottawa Senators hold the shame of most goals against with 302. It shouldn't come to any surprise that they did not qualify for the playoffs.
However, you would think with the worst goals against, they'd also hold the title for worst goal differential (DIFF column).
If you're not sure what this stat is, check out my blog post here for a full explanation.
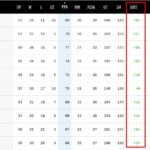
So anyway, the Los Angeles Kings finished with the worst goal differential at -61, beating out the Senators by one goal for last place.
Final Thoughts
Assessing the average number of shots per game was easy. We determined that number to be 63 for the NHL 2018-19 Season.
When we dug a little deeper, we noticed that the average shot count has gone up these last 3 seasons (2019-20 included).
As a result, we saw an NHL record broken for goals for, with 7,577 (2018-19).
It'll be interesting to see what the final shot numbers and goals scored will look like over the next few seasons.
And if you think you know why the shot count is going up, please leave a comment below.
