In hockey, the goals against average (GAA) is a statistic that applies specifically to goaltenders. It is the number of goals scored on a goalie over 60 minutes of play.
You may have heard it described as the average number of goals allowed per game, but this definition is not entirely accurate.
The reason is simply that games can extend into overtime, resulting in beyond 60 minutes of play.
In addition, if a goalie were pulled during a game for an extra attacker, their time on the bench is deducted from the total game time. In other words, their total playing time would be less than the game time.
Below, I demonstrated how to calculate the goals against average for each goalie in a game that ended 4-3 in overtime.
In this example, the game finished after 2 minutes played of overtime and the goalies were never pulled from either of their nets.
Winning Goalie GAA:
3 goals allowed / (62 minutes played / 60 minutes of play) = 2.90 GAA
Losing Goalie GAA:
4 goals allowed / (62 minutes played / 60 minutes of play) = 3.87 GAA
As you can see, their goals against average were slightly less than expected because of the extra 2 minutes played in overtime.
Now that we’ve got the math out of the way, what can we expect from goalies at the NHL? Or rather…
What is a Good Goals Against Average in Hockey?
A good goals against average will fall between 2.00 and 2.70 for NHL goaltenders. Anything between 2.70-3.00 is considered respectable, while below 2.00 is very exceptional. Andrei Vasilevskiy of the Tampa Bay Lightning won the 2019 Vezina Trophy for the NHL’s best goaltender, finishing with a 2.40 goals against average.
As a note, the other Vezina Trophy nominees Ben Bishop (Dallas Stars) and Robin Lehner (New York Islanders) finished respectively with 1.98 and 2.13 goals against average.
Although they had better goals against averages, other factors are taken into consideration including save percentage and win record.
Ultimately, Andrei Vasilevskiy finished with the most wins (39) and helped backstop the Tampa Bay Lightning to an amazing 62-16-4 record. This was likely the main reason why he claimed the prize for best goalie in 2018-19.
In the end, the league average GAA was 2.81 for all starters and backups combined (source).
You might be wondering what type of goals against average would allow teams to qualify for a playoff berth.
So, I decided to compare the goals against average stat of playoff vs non-playoff teams and even separated the starting goalies from the backups.
Teams always have high expectations for their starting goaltenders, but they rely just as much on their goalies that come in relief.
Which is why teams pursue a solid backup goalie that can deliver additional team wins in the overall standings.
They’re especially needed when teams play on back-to-back days. In today’s NHL, starters should be rested in one of those games to minimize risk of injury.

Goals Against Average (GAA) for Goaltenders on Playoff Teams
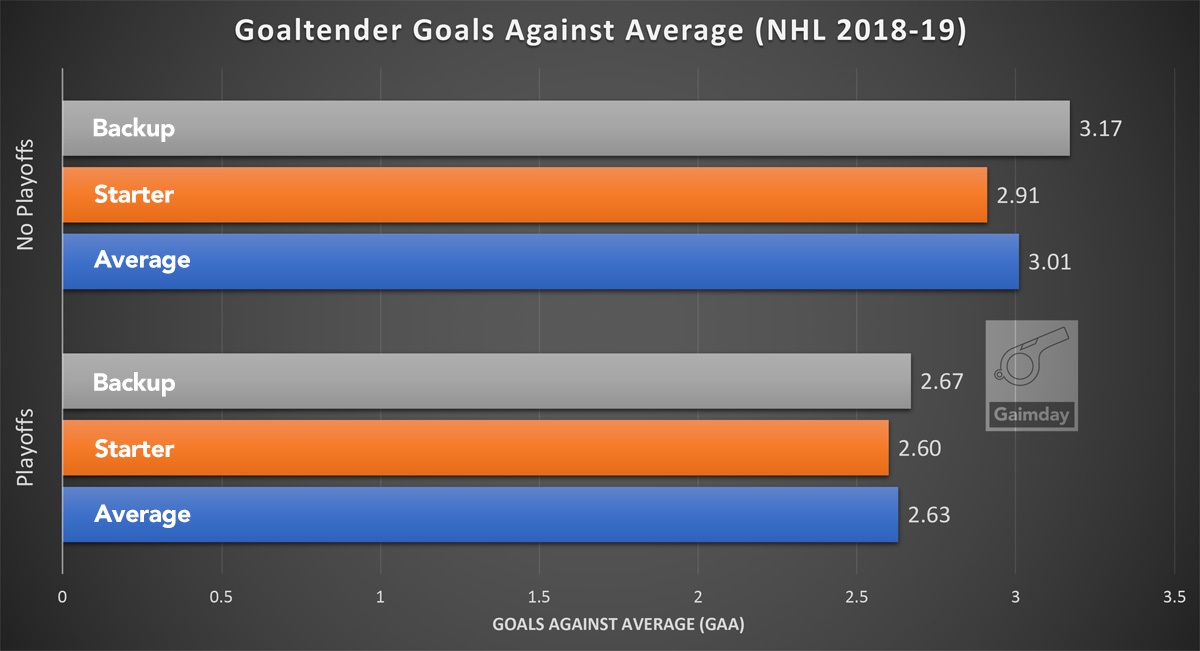
The average goals against for goalies on playoff teams was 2.63 during the 2018-19 NHL season.
Starting goaltenders had a slightly better average with 2.60, while the backups maintained a 2.67 GAA.
As mentioned earlier, Ben Bishop had the best goals against average amongst all starters with a 1.98 GAA in 45 season starts. Of all starters to qualify for playoffs, Martin Jones (San Jose Sharks) had the worst goals against average with a 2.94 GAA.
Goals Against Average (GAA) for Goaltenders on Non-Playoff Teams
Meanwhile, the average goals against for goalies on non-playoff teams was 3.01 GAA.
Starting goaltenders for non-playoff teams showed some promise with a 2.91 GAA, while the backups were managing a 3.17 GAA on average.
The best amongst non-playoff goalies was Darcy Kuemper (Arizona Coyotes) who managed a 2.33 GAA in 55 starts, while Craig Anderson (Ottawa Senators) had a 3.51 GAA.
Undoubtedly, the goals against average help measure a goalie’s performance during the season but shouldn’t be used exclusively.
Save Percentage (SV%)
Teams need to also consider also a goalie’s save percentage to better map what is going on in each game.
If you want to learn more about save percentage (SV%), make sure to check out my blog post here. I explain how it’s calculated and define the percentage needed to qualify for a playoff berth in the 2018-19 NHL season.
In short, if a goalie’s GAA and save percentage are both high, there might be an underlying problem with the team. That is, the goalie might not be to blame whatsoever.
Perhaps the reason a goalie may be giving up so many goals is because they’re facing too many shots per game. What can make things worse is that the team is not shooting as much or simply always scoring less on the opposition.
Shifting our focus back on the goalie, let’s consider the following performance scenarios:
Goalie 1:
3 goals on 50 shots – 3.00 GAA and 0.940 SV%
Goalie 2:
3 goals on 20 shots – 3.00 GAA and 0.850 SV%
Although both goalies would finish with a 3.00 GAA, Goalie 1 was able to save a higher percentage of shots. If his team were to decrease “shots against”, in theory the goalie should allow less goals against.
The best example I could find was with John Gibson (Anaheim Ducks) in the 2018-19 NHL Season. He finished with a below average 2.94 GAA, but an above average 0.917 SV% (0.910 average SV%).
Goal Differential (DIFF)
By looking quickly at how many goals the Ducks scored compared to how many they allowed, I could draw some conclusions. Basically, the Anaheim Ducks had a goal differential of -52 over the entire season, meaning they scored far less often than their opponents.
If you want to learn more about goal differential (DIFF), you can read my blog post here. I explain how goal differential is calculated and its role in determining NHL standings.
Ultimately, Gibson should not have been blamed for the failed season. What’s also interesting is that his backups fared better with a 2.85 GAA, but worse in save percentage (0.907 SV%). The stats indicate that they allowed less goals against, but still let in a higher percentage of shots through.
Final Thoughts
Since there were so many statistics thrown at you, let me break down how I would grade various ranges for goals against average.
| Goals Against Average (GAA) | Description |
|---|---|
| <2.00 | Excellent |
| 2.00-2.40 | Very Good |
| 2.41-2.70 | Good |
| 2.71-3.00 | Fair |
| >3.00 | Bad |
As mentioned before, the goals against average alone is not enough to properly evaluate a goalie. The moment the goals against climbs above 2.70 GAA, other stats should be reviewed, including a goalie’s save percentage.
If the goalie’s save percentage is also high, the problem may lie in the performance of the team as a whole. For example, it could be that the team is allowing too many shots on net.
And the more shots on net, the greater chance of being scored against.
When a netminder allows more than 3.00 GAA and lower than 0.900 SV%, the alarm bells start ringing with coaches and management.
At the same time, when a goalie’s GAA falls below 2.00 with a save percentage above 0.920, we are now talking Vezina Trophy consideration.
So as you are watching the season wrap up, try figuring out which goalies deserve praise. Look closely at the GAA of starting and backup goaltenders to get an idea of why your team did (or didn't) qualify for playoffs.


