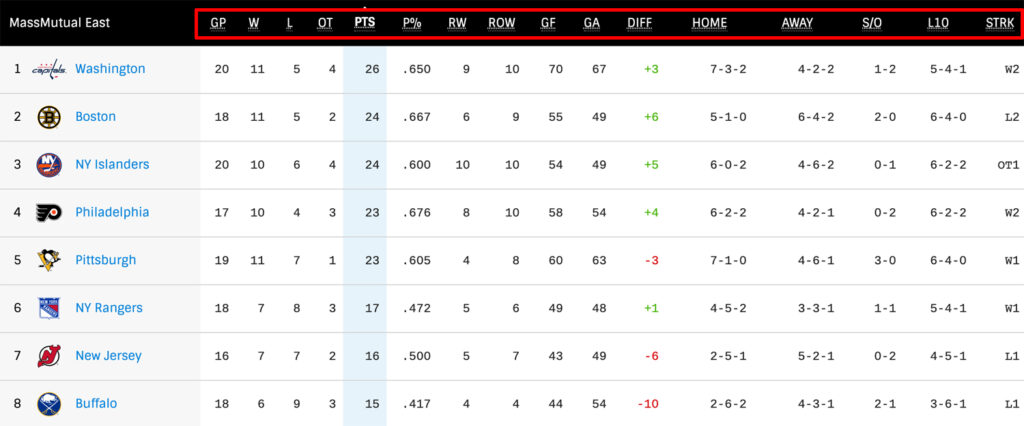
The official NHL Standings consists of 16 columns, not just the team record for Wins-Losses-Overtime or Shootout Losses (W/L/OT). (source)
Most of them directly affect team standings, but not all of them do.
For those that play a role in the standings, I explain how. And for those that don't, I point them out.
Furthermore, I provide examples, tables and describe the level of importance for columns when it comes to tie-breakers. That is, who finishes ahead in standings when teams are tied in points.
Have you ever asked yourself why a team finishes ahead of another? I break down these rules employed by the NHL in detail.
Continue reading for the answers, or use the table of contents below to skip to your preferred column description.
GP - Games Played
The Games Played column describes how many games each NHL team has played to date. In a typical NHL season in today's era, each team would play 82 games. 41 home games and 41 games played on the road.
The 82-game system has been in place since the 1995-96 NHL season. There have been some exceptions since then, including lockout seasons and COVID-19 breakout most recently.
As a note, the 2020-21 NHL Season was temporarily reduced down to 56 games.
W - Wins
Each team win is added onto Wins column, regardless if the team won in regulation time, overtime or shootout.
However, total regulation wins can play a role in the order of final team standings. I'll explain this further in the RW and ROW columns.
Each win earns a team 2 points, which is added to the total in the PTS column (explained below).
Furthermore, Total Wins is Rule #4 in priority for determining the tie-breaking procedure. So, when two or more teams have equal points in the standings, the Win column can play a factor in determining which one finishes ahead.
L - Losses
Losses are represented solely by regulation time team losses. They are distinct from overtime and shootout losses because teams earn 0 points for regulation losses.
OT - Overtime or Shootout Losses
Overtime or shootout losses are losses that teams collect beyond regulation time (standard 60-minute game).
Each overtime or shootout loss earns a team 1 point in the standings.
PTS - Points
Team points are calculated by adding points for each win (2 PT), loss (0 PT) and overtime or shootout losses (1 PT).
Team positions in the standings are sorted primarily by the Points column. Teams that are tied in points are subject to further scrutiny using the tie-breaker procedure. We'll looking into this more in detail, shortly.
P% - Points Percentage
Points percentage is calculated by dividing the total points in the PTS column with total possible points for all games played (2 pts per game).
For example, if the Montreal Canadiens earned 22 points in 19 games, the points percentage is calculated as followed:
Points Earned = P%
Games Played x 2
22 PTS = 0.579 P% for Canadiens
19 GP x 2
The Points Percentage only factors in the standings if teams have played an unequal amount of games.
Generally speaking, teams should play the same number of games by the end of the season - 82. But in the unlikely event that they don't (i.e COVID), the P% plays a significant role in the rankings.
In fact, the Points Percentage is designated the #1 Rule in determining the tie-breaking procedure.
So, if two teams are equal in points, the team with a higher points percentage will always rank higher.
RW - Regulation Wins
Any time a team wins in regulation time, it is added into the RW column.
Regulation Wins is Rule #2 in priority for determining the tie-breaking procedure. That is, the team with more regulation wins will finish ahead of the team other tied with them in total points.
If you'd like an in-depth look into the subject of regulation wins, make sure to check out my blog post here on What Does RW Mean in Hockey Standings?.
The example below displays a simple scenario where both the Canadiens and Panthers are equal in points, but the Canadiens finished with more regulation wins.
NHL Standings Scenario - RW
Divisional Standings | Teams | GP | W | L | OT | PTS | RW | ROW |
|---|---|---|---|---|---|---|---|---|
3 | Boston Bruins | 82 | 45 | 25 | 10 | 100 | 36 | 40 |
4 | Montreal Canadiens | 82 | 42 | 26 | 14 | 98 | 32 | 37 |
5 | Florida Panthers | 82 | 43 | 27 | 12 | 98 | 30 | 38 |
ROW - Regulation plus Overtime Wins
Whenever a team wins a game in regulation or overtime, it is added to the ROW column. Shootout victories are excluded from the totals.
ROW (Regulation plus Overtime Wins) is Rule #3 in for determining the tie-breaking procedure. So, when 2 or more teams are tied in points and regulation wins, the ROW column becomes a factor in standings.
In the example below, the Canadiens and Panthers are equal in points and RW wins, but Canadiens have more ROW wins. The Canadiens would finish ahead of the Panthers because of their advantage in ROW wins, despite the Panthers having finished with more overall wins.
The reason is that the Panthers accumulated some of their wins in the shootout, which has less value than regulation or overtime wins.
NHL Standings Scenario - ROW
Divisional standings | Teams | GP | W | L | OT | PTS | RW | ROW |
|---|---|---|---|---|---|---|---|---|
3 | Boston Bruins | 82 | 45 | 25 | 10 | 100 | 36 | 40 |
4 | Montreal Canadiens | 82 | 42 | 26 | 14 | 98 | 32 | 38 |
5 | Florida Panthers | 82 | 43 | 27 | 12 | 98 | 32 | 37 |
For a deeper look into the ROW column, I invite you to read my blog post here on What Does ROW Mean in Hockey?
GF - Goals For
Goals For stands for the total amount of goals scored by the team against their opponents.
When a team wins in a shootout, the Goals For count goes up by one. However, that goal is not credited to any individual player, but rather to team.
Were you to calculate the sum of all goals scored by individual players on the team, it will always be equal to or less than the value in the Goals For column.
Goals For Totals is Rule #7 (last) in priority for determining the tie-breaking procedure. When all other tie-breakers rules solve nothing, the team with the most goals for will finish ahead in the standings.
GA - Goals Against
Goals Against stands for the total amount of goals scored by the opponents on the team in question.
In this case, the Goal Against value increases by one when the team loses in a shootout. This type of goals against does not change a goalie's save percentage (SV%) nor their goals against average (GAA).
Shootout goals are counted as a Goals Against for the team only.
DIFF - Goal Differential
The value in the Goal Differential column is the difference between Goals For and Goals Against. The final value for Goal Differential can be either positive or negative.
It is calculated using the following formula:
Goals For - Goals Against = Goal Differential (DIFF)
295 GF - 260 GA = +35 (DIFF)
Goal Differential is Rule #6 for determining the tie-breaking procedure. The team with the higher differential finishes ahead of the other teams that are tied.
For a more detailed description of the DIFF column, make sure to check out my blog post here on What Does DIFF Mean in Hockey Standings?
HOME - Home Record
Home Record is a stat that monitor's the team's winning record for games played exclusively at their home venue.
When it comes to significance in the overall standings, the home record doesn't play any role.
Lastly, the record is displayed as Wins (W) - Losses (L) - Overtime or Shootout Losses (OT)
Example: 7-2-1 = 7 Wins - 2 Losses - 1 OT (HOME Record)
AWAY - Away Record
Away Record reports a team's record for all games played on the road. Similar to the Home Record, it has no significant role in determining a team's position in the standings.
Furthermore, the stat is reported the same way as the home record.
Example: 5-6-2 = 5 Wins - 6 Losses - 2 OT (AWAY Record)
S/O - Shootout Record
The Shootout Record is the team record for wins and losses in the shootout.
Example: 7-3 = 7 Wins & 3 Losses in the Shootout
Although the shootout record plays no role the overall team rankings, it can be used to quickly calculate the ROW column.
For example, if a team has 40 wins total, and 7 came from shootout, then the ROW value 33. This is done by subtracting the 7 shootout wins from the total win count.
Although the shootout record plays no role the overall team rankings, it can be used to quickly calculate the ROW column.
For example, if a team has 40 wins total, and 7 came from shootout, then the ROW value 33. This is done by subtracting the 7 shootout wins from the total win count.
L10 - Record in Last 10 Games
L10 is the record for a team in the last 10 games. Again, this is another stat plays no important role in team standings.
If anything, it gives you an idea of a team's recent performance and if they are building momentum towards team success or failure.
STRK - Streak
While the L10 record tells you a story about the team's record in the last 10 games, you're not given the order of the wins, losses or OT losses.
The STRK column slightly provides a more accurate picture. STRK stands for a recent team's streak for wins, losses or overtime/shootout losses.
For example, if the team's L10 was 6-4, the STRK stat might display a value of W6, meaning the team won their last 6 consecutive games.
STRK Scenarios:
W6 - Won the last 6 consecutive games
L3 - Lost the last 3 games in a row
OT1 - Lost the last game in overtime or shootout
You may sometimes hear broadcasters speak of a team's current winless or point streak. As an important note, these reported type of streaks will not appear in the STRK column.
A winless streak is when a team has gone without a win for consecutive games, but have not necessarily gone pointless.
That is, they may have lost 5 consecutive games, but two of those games were lost in overtime. In this case, the team still earned 2 points during those losses.
A point streak is when a team accumulates points several games in a row. It differs from a winning streak in that the team have earned points in those games with a mix of wins and overtime (or shootout) losses.
Lastly, the STRK column does not contribute to the team's overall standings.
Final Thoughts
If you were paying close attention, you'd notice that one of the tie-breaker rules wasn't discussed.
That is Tie-Breaker Rule #5.
The reason is that none of the columns are directly implicated with this rule. The NHL states rule #5 by the following:
"The greater number of points earned in games against each other among two or more tied clubs. For the purpose of determining standing for two or more Clubs that have not played an even number of games with one or more of the other tied Clubs, the first game played in the city that has the extra game (the "odd game") shall not be included. When more than two Clubs are tied, the percentage of available points earned in games among each other (and not including any "odd games") shall be used to determine standing."
It's a bit of a head scratcher, but I'll do my best to explain it in layman's terms.
When two teams are tied in the standings and this rule needs to be enforced, their head-to-head confrontations are scrutinized.
Most teams will split visits equally between their home venues and their opposition's venue. If the teams played each other an odd amount of games (i.e. 5 or 7), the first game played at the venue most frequented is discarded for the ruling.
With that said, the NHL looks at the points earned by each team in the head-to-head confrontation. The team with the higher points percentage (P%), will finish ahead in the standings.
If the teams are equal in points, then we continue down to the next rule for the tie-breaker.
")
")
")
")

")