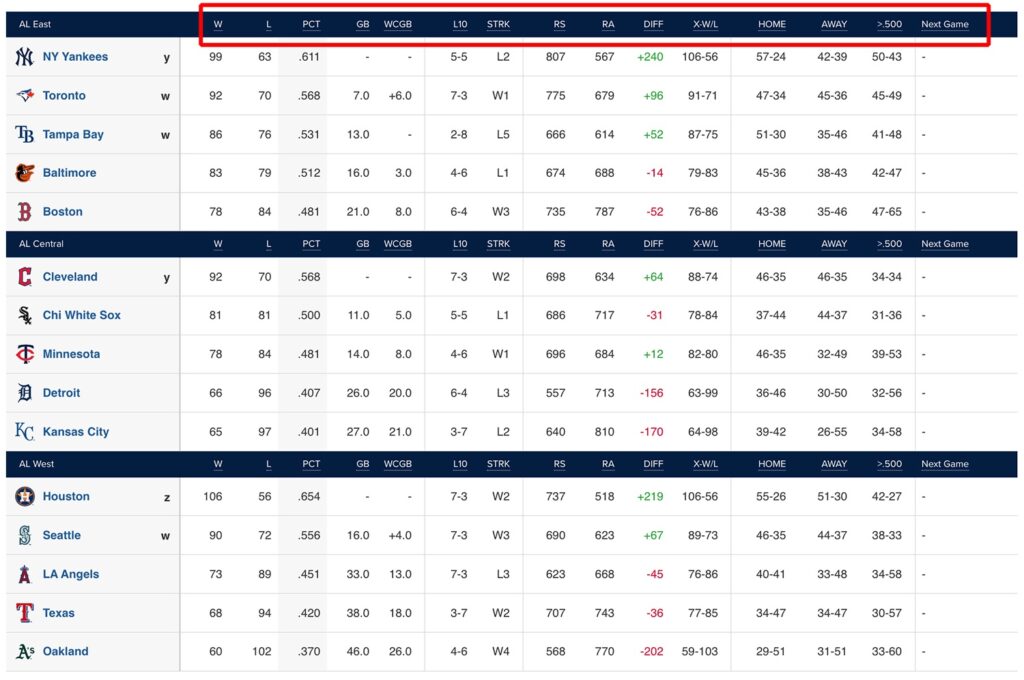
The official MLB Standings consists of 15 columns, not just the team Win-Loss record.
These additional columns play a role in team rankings, especially when two or more have equal records.
For those that affect the standings, I break each column down. And for those that don't, I point them out.
Furthermore, I provide examples, tables and describe the level of importance for columns when it comes to tie-breakers. That is, who finishes ahead in standings when teams have the same record.
Have you ever asked yourself why a team finishes ahead of another? I break down these rules employed by the MLB in detail.
Continue reading for the answers or use the table of contents below to skip to your preferred column description.
W – Win Column
Each team win is added onto Win column, regardless if the team won in regulation or extra innings.
L – Loss Column
Losses are added to the Loss Column for both regulation and losses in extra innings.
PCT - Winning Percentage (Win %)
PCT or the Win Percentage is the portion of wins earned from the total games played per team. PCT is reported as a fractional value rounded up to three decimal places.
We calculate the Win Percentage as follows:
PCT = Wins / Total Games Played
Total Games Played = Sum of all Wins + Losses
PCT = 92/162 = 0.568 (value rounded up to third decimal)
GB - Games Behind or Games Back
Games Behind indicates how many games each team trails their first-place, divisional rival. Games Back values shift in increments of 0.5 per game played, per team.
When a trailing team wins a game, they reduce their game’s back deficit by 0.5 games.
If they are the top team in the division, they would expand their lead by 0.5 games.
Meanwhile, they’d increase their deficit by 0.5 games following a loss.
I cover the Games Behind column in more detail on my blog post What does GB Mean in Baseball?
WCGB – Wild Card Games Behind
Wild Card Games Behind works in a similar way to GB, except that it tracks how far behind a team is compared their opponent holding the Wild Card spot.
Since there are three teams that clinch Wild Card positions, the column measures the difference with the lowest ranking Wild Card team.
To gain a better perspective, sort the teams using the League option (American and National).
The Wild Card spots are given to the top 3 teams in each league that are not divisional leaders.
For more information on WCGB, check out my blog post here.
L10 – Record over last 10 games played (Last10)
L10 is the record for a team in the last 10 games. Again, this is another stat which doesn’t play any role in team standings.
It’s likely used for sports gambling where the bettor may interpret that a team will continue or break their momentum.
Streak – Recent Winning or Losing Streak
While the L10 record tells you a story about the team's record in the last 10 games, you're not given the order of the wins or losses.
The Streak column slightly provides a more accurate picture. It stands for a recent team's streak for wins or losses.
For example, if the team's L10 was 6-4, the Streak stat might display a value of W6, meaning the team won their last 6 consecutive games.
RS – Runs Scored
Runs scored are the points a team obtains during a game, every time their players safely cross Homeplate.
Points are scored off home runs, runs batted in (RBIs), stealing home plate, bases loaded walks and so on.
RA – Runs Allowed
Runs allowed are the total points scored against the corresponding team. These runs are added up for all the games played so far on the season.
DIFF – Run Differential
DIFF, or Run Differential, is determined by subtracting the Runs Allowed from the Runs Scored for any given team.
Run Differential is used to estimate the expected team record compared to their actual Win-Loss record.
The expected team record is reported in the next column over: X-W/L.
We cover this below.
As a note, the DIFF stat doesn’t play a role in team rankings.
X-W/L – Expected Win-Loss Record Based on Runs Scored and Runs Allowed
Also known as the Pythagorean Winning Percentage, the X-W/L column is used to forecast a team’s future outlook.
That is, their actual Win-Loss record can appear stronger, weaker or even to their expected record.
The formula was first developed by renowned statistician Bill James, and later optimized by Baseball-Reference.com.
Baseball-Reference simply adjusted the exponent value from 2 to 1.83, to narrow the margin of error. (Formula shown below)
While it has no significant role in sorting team rankings, it indicates whether the team is over- or underperforming based on the runs scored and runs allowed.
The formula to calculate X-WL is as follows:
X-WL% = (RS^1.83) / [(RS^1.83) + (RA^1.83)]
Where ^ is "to the power of”, RS is Runs Scored and RA is Runs Allowed.
X-WL% = fractional value, similar to the Winning Percentage (or PCT)
To calculate how many expected Wins, multiply the X-WL value with the total number of games played.
Example: If X-WL% = 0.600, then…
0.600 * 162 = 97.2
Round the value to the nearest whole number to determine Win total: 97 Wins
Subtract the Win count from the total games played: 162-97 = 65 Losses
X-WL = 97-65 Win-Loss Record
HOME – Record at Home
Home Record is a stat that monitor's the team's winning record for games played exclusively at their home venue.
The home record doesn’t play any role in determining team rankings.
ROAD – Record When Away
Away Record reports a team's record for all games played on the road.
Similar to the home record, the away record plays no role in a team’s position in the standings.
>.500 – Record Against >.500 Teams
This stat is to indicate how well a team performs against opponents with winning records, which is >.500 actual Winning Percentage.
Again, this column has no value in determining the ranking of teams.
Should the team qualify for the postseason, we get an idea of how they would fair against their rival.
Keep in mind that most playoff teams, if not all, will have a winning record.
So, the greater your team’s regular season performance against strong teams, the greater their chances at succeeding in the postseason.
Next Game
During the season, the MLB uses this column to report the team’s opponent for the upcoming game.
Final Thoughts
MLB Standings become very interesting as of the last quarter of the season, around when 40 games remain per team.
When teams are battling for playoff contention, many scenarios can emerge.
Will the team ranked ahead seal the deal and take charge of their own destiny?
Can the team, looking from the outside in, clinch a playoff spot against all odds?
This can become very nerve wracking.
And what if two or more teams finish with the same record in the standings? We’ve covered some of those scenarios above.
Check out the full set of tie-breaker rules applied by the MLB here.
Basically, they compare various team records including head-to-head, intra/interdivisional and intraleague match ups.
")
")
")

")
