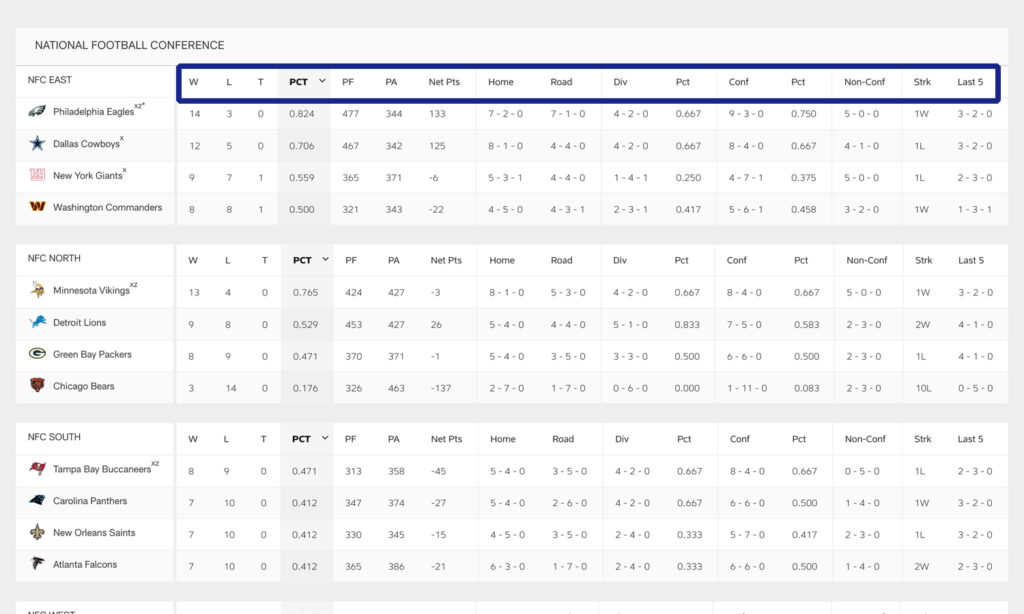
The official NFL Standings consists of 17 columns, not just the team Win-Loss-Tie record.
These additional columns play a role in team rankings, especially when two or more have equal records.
For those that affect the standings, I break each column down. And for those that don't, I identify them and still provide an explanation.
Furthermore, I give examples, tables and describe the level of importance for columns when it comes to tie-breakers. That is, who finishes ahead in standings when teams have the same record.
Have you ever asked yourself why a team finishes ahead of another? I break down these rules employed by the NFL in detail.
Continue reading for the answers or use the table of contents below to skip to your preferred column description.
Team - Team & Rank Status
The team column simply consists of every team name along with their location.
For the most part, locations are represented by the city name, but there are exceptions such as the Tennessee Titans, the Minnesota Vikings, Carolina Panthers and Arizona Cardinals.
Their arenas are located in Nashville, Minneapolis, Charlotte (North Carolina) and Phoenix respectively.
As for the New England Patriots, the team is located in Boston.
For those that don’t know, New England a region in the eastern United States comprised of 6 states: Connecticut, Maine, Massachusetts, New Hampshire, Rhode Island, and Vermont.
Boston is a city based in the state of Massachusetts.
As the season winds down, letters and symbols start appearing next to the name of each team in superscript.
These markings represent the rank status for each team in regards to playoff qualifications.
Teams that clinch conference or division titles are all guaranteed playoff spots.
I've included the complete Rank Status glossary below:
| Rank Status | Description |
|---|---|
| x | Clinched Playoff Berth |
| y | Clinched Wild Card |
| z | Clinched Division |
| * | Clinched Division and Homefield Advantage |
W – Win Column
Each team win is added onto Win column, regardless if the team won in regulation or overtime.
L – Loss Column
Losses are added to the Loss Column for both regulation and overtime losses.
T – Tie Column
Ties are added to the Tie Column when neither team wins the game in overtime.
PCT - Winning Percentage (Win %)
PCT or the Win Percentage is the portion of wins earned from the total games played per team. PCT is reported as a fractional value rounded up to three decimal places.
We calculate the Win Percentage as follows:
PCT = Wins + (Ties x 0.5) / Total Games Played
EXAMPLE:
Total Games Played = Sum of all Wins + Losses + Ties
9 Wins, 7 Losses, 1 Tie
PCT = (9 + 0.5)/17 = 9.5/17 = 0.559 (value rounded up to third decimal)
PF – Total Points For
Total Points For is the accumulation of points scored on offense in all games.
PA – Total Points Against
Total Points Against is the accumulation of points given up to the opposition in all games.
Net Pts - Net Points
The value of Net Points is the difference between Total Points For and Total Points Against.
It is calculated using the following formula:
Net Points is found in Rules #9 and #10 for the tie-breaking procedure.
For rule #9, the team with the higher differential between common opponents finishes ahead of the other team(s).
If the Net Points are equal, then rule #10 applies in which the team with the higher differential for all games finishes ahead of the other team(s).
Home - Home Record
Home Record is a stat that monitor's the team's winning record for games played exclusively at their home venue.
When it comes to significance in the overall standings, the home record doesn't play any role.
Lastly, the record is displayed as Wins (W) - Losses (L) - Ties (T)
Example: 5-2-1 = 5 Wins, 2 Losses and 1 Tie
Road - Road Record
Away Record reports a team's record for all games played on the road. Similar to the Home Record, it has no significant role in determining a team's position in the standings.
The record is also displayed as Wins (W) - Losses (L) - Ties (T)
Example: 4-5-0 = 4 Wins, 5 Losses and 0 Ties
Div - Division Record
The division record refers to a team’s record playing divisional rivals. There are 8 divisions, split into two conferences.
Each division is made up of four teams each and are organized in the following manner:
American Football Conference – AFC East, North, South and West
National Football Conference – AFC East, North, South and West
Similar to conference rivalries, teams play a fixed amount of games against their divisional rivals each year – 6.
The Division Record may play a role to settle tie-breakers in the standings.
It is the 2nd rule in the tie-breaking procedure for both two-way or multi-way ties.
In the end, the team with the better division won-lost-tie percentage will always rank higher.
Example: 3-2-1 = 3 Wins, 2 Losses and 1 Tie
Pct (Div) - Division Percentage
The Division Percentage relates to the winning percentage of the team within their division. It is calculated the same way as the general Winning Percentage.
Conf - Conference Record
As noted above, there are two conferences in the league: AFC and NFC.
On top of having to play divisional rivals six times during the season, teams are required to play 12 games within their own conference.
The Conference Record may play a role to settle tie-breakers in the standings.
It appears both in the #4 and #7 rule of the tie-breaking procedures for both two-way or multi-way ties.
For rule #4, if two teams are tied within the conference, the team with the best won-lost-tied percentage will always rank higher.
Keep in mind that a conference tie is important when it comes to clinching a wild card spot for the playoffs.
Three teams in conference make the playoffs through wild card.
And since the there are only 17 games in a season, the tie-breaker rule has an increased chanced of determining who qualifies and who doesn’t.
Example: 6-6-0 = 6 Wins, 6 Losses and 0 Ties
Pct (Conf) - Conference Percentage
The Conference Percentage relates to the winning percentage of the team within their conference. It is calculated the same way as the general Winning Percentage.
Non-Con - Record against Non-Conference Teams
Each team plays a fixed amount of games against their non-conference rivals each year – 5.
While the non-conference record is also illustrates the Win-Loss-Tie record of every team, it plays no significant role in determining the ranking or playoff spot.
Example: 4-1-0 = 4 Wins, 1 Loss and 0 Ties
Strk - Streak
While the L5 record tells you a story about the team's record in the last 5 games, you're not given the order of the wins, losses or ties.
The STRK column slightly provides a more accurate picture. STRK stands for a recent team's streak for wins, losses or ties.
For example, if the team's L10 was 6-4, the STRK stat might display a value of W6, meaning the team won their last 6 consecutive games.
Last 5 - Record in Last 5 Games
L5 is the record for a team in the last 5 games. Again, this is another stat plays no important role in team standings.
If anything, it gives you an idea of a team's recent performance and if they are building momentum towards team success or failure.
Tie-Breaker Rules
For a full breakdown of the official NFL tie-breaker procedues, make sure to check out the following link.
Final Thoughts
Of all the professional team sports, the NFL playoff picture is both always the most confusing and exciting at the same time.
Almost every season, you see the playoff qualifications come down to the wire.
That's because teams play only 17 games during the season, and the record variation in small.
The confusing part is when the TV announcers put up a chart explaining how 3 or more teams are in the mix of things and which remaining game outcomes benefit each one.
You'll hear something like Team A needs to beat Team B, while Team C must lose their game all in order for Team A to make the playoffs.
And this is one of the easier examples.
Imagine Team A must win by a certain points differential to qualify over another rival in the standings on top of that.
It simply opens a can of worms with your head spinning worse than during a high school Physics test.
Don't worry though, the NFL will have it all sorted out for you in the end.
It's just easier when your team finishes with a higher winning percentage and there's no need to turn on the panic button.
")
")
")
")

