Right now, you've looked at the blog title, you saw the accompanying featured image, and you're wondering about those 3 numbers in the hockey standings.
If you’ve just started following the NHL, you might already be confused by all the numbers that are thrown at you.
Just by watching a single game, you’ll learn that there are 3 periods each twenty minutes in length, 5 minutes of overtime and three starting shooters for each team in the shootout.
Furthermore, you’d count up to 20 players on each roster bench (and on the ice) typically made up of 12 forwards, 6 defensemen and 2 goalies.
Sometimes the tv broadcasters will show an individual player’s stats representing their scoring totals (Goals-Assists-Points).
Let's take the totals from Leon Draisaitl in the 2019-20 Season.
To date, he has a point total of 43-67-110 representing his record for G-A-Pts as stated above.
And that’s just the start.
When you're looking up the team as a whole, you’ll often wonder if they’re performing well and how their success is measured.
We all know in sports that teams will either win or lose a game – sometimes finish in a tie.
As a note, NHL no longer allows for games to end in a tie. A little more on that as you continue reading.
The NHL is no different and they display team records using an abbreviated three-number point system.
What are the three numbers in hockey standings?
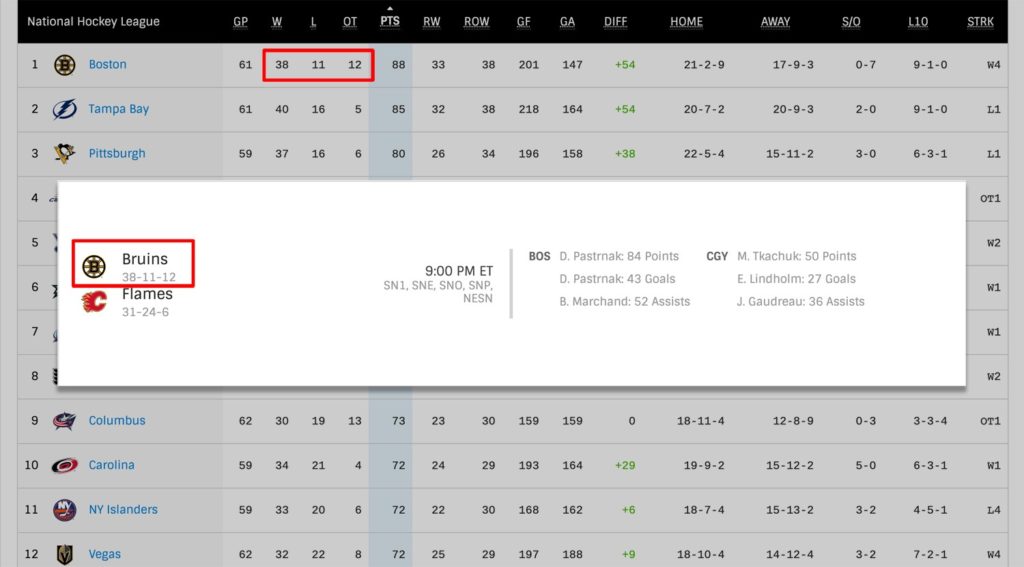
The 3 numbers next to an NHL team’s name or logo refers to their “Wins-Regulation Losses-Overtime Losses” record (ex: 62-16-4). Regulation and overtime losses are separated because of their value in the standings. Regulation losses earn teams 0 points while overtime losses earn them 1 point. Wins, however attained, earn teams 2 points.
In the example above (62-16-4), we can quickly calculate how many points the team finished the season with in the NHL standings.
62(2) + 16(0) + 4(1) = 128 points

Note that the 3 numbers didn’t always have the same meaning. In fact, at one point, teams had their NHL records represented by 4 numbers.
Let’s take a look at this below.
History of Team Records
From 1917 until 1999, points in the NHL standings were calculated based on a team’s “Wins-Losses-Ties” record.
Back then, regular season games would end in a tie either after regulation time expired or following an overtime period.
Between 1942 and 1984, there was no overtime period at all. The reason for its removal was due to war time restrictions.
When it was reinstated, the NHL adopted a 5-minute sudden death overtime – what we see in games still until today, at least in the regular season.
So, a team with a 40-35-7 (W-L-T) record would earn the following points in the standings:
40(2) + 35(0) + 7(1) = 87 points
Between the 1999-00 and 2003-04 seasons, the NHL shortly adopted the 4-number point system.
The numbers represented a team’s “Wins-Losses-Ties-Overtime Losses” (W-L-T-OT) record.
This was the first time teams were awarded a point for losing in overtime.
At the time, the league suspected that teams were playing too conservatively against one another.
That’s because they would prefer to secure 1-point each in overtime, rather than risk losing the game (and earn 0 points).
By awarding each team with 1 point for making it past regulation time, the league now expected teams to be more aggressive during the overtime period.
The overtime rules were again changed following the 2004-05 lockout season.
When the league resumed play in 2005-06, teams were introduced to the shootout so that every game can decide a clear winner.
As a result, ties were abolished from the standings and no longer required in the team records.
Which brings us all the way to the present, where team records are displayed as Wins-Regulation Losses-Overtime Losses.
What are the possible outcomes for each team in a game?
In the table below, we explain the possible game outcomes and how teams can earn points in the NHL standings.
| Game Outcome | Points Earned |
|---|---|
| Regulation Win | 2 Points |
| Overtime Win | 2 Points |
| Shootout Win | 2 Points |
| Regulation Loss | 0 Points |
| Overtime Loss | 1 Point |
| Shootout Loss | 1 Point |
Wins earn teams 2 points, but are not all valued the same
You probably noticed that whichever way teams win a game, they earn 2 points in the standings.
However, not all wins are seen in the same light - at least from the NHL's point of view.
The wins are weighted based on if they were accomplished in regulation time, overtime or in shootout.
If you’re interested to learn about the value of each win type, you’ll want to check out my blog post here.
I explain how the ROW in the standings apply to wins and the one major change made in 2019-20 (hint: RW column).
In short, if 2 or more teams finish with the same point totals in the standings, the number of wins and how they were achieved can affect where they rank in the standings.
In the end, some teams may not qualify in the playoffs while others can gain home ice advantage.
Furthermore, teams that are ranked closer to the bottom have a better chance of winning the draft lottery the next year.
Basically, to get bad teams out of the proverbial gutter, the league rewards them with greater odds of drafting the next set of rising young stars.
Number System for other Notable Leagues
Not all hockey leagues use the same number system or accord points exactly the same way as in the NHL.
I've included a table displaying the format used by other leagues in North America and around the world.
For some, team records were not marked clearly on official league websites like they were for the NHL.
However, I still provided a detailed explanation on how points are awarded based on the standings.
| LEAGUE | NUMBER SYSTEM | DESCRIPTION |
|---|---|---|
| Kontinental Hockey League (KHL) | W/OTW/SOW/SOL/OTL/L | 2-point system which translates to Regulation Wins, Overtime Wins, Shootout Wins, Shootout Losses, Overtime Losses, Regulation Losses |
| American Hockey League (AHL) | W/L/OTL/SOL | 2-point system which translates to Wins, Regulation Losses, Overtime Losses, Shootout Losses |
| East Coast Hockey League (ECHL) | W/L/OTL/SOL | 2-point system which translates to Wins, Regulation Losses, Overtime Losses, Shootout Losses |
| Swedish Hockey League (SHL) | 3P-2P-1P-0P | 3-point system described in terms of points awarded and translates to Regulation Wins (3P), Overtime/Shootout Wins (2P), Overtime/Shootout Losses (1P), Regulation Losses (0P) |
| National League (NL) aka Swiss | W/OTW/SOW/SOL/OTL/L | 3-point system which translates to Regulation Wins, Overtime Wins, Shootout Wins, Shootout Losses, Overtime Losses, Regulation Losses |
Final Thoughts
The NHL is a constantly-evolving league and the way team records are displayed in the standings are not exempt to change.
There are some in the hockey world that still object to the inclusion of the shootout. And if they had their way, the league would, at least, go back to tie games .
Each year, the league commissioners and team managers get together to discuss adding, modifying or removing rules to better the game.
As recently as 2019-20, we saw a major distinction between winning games 5-on-5 in regulation over 3-on-3 overtime.
As stated before, even those sitting in manager positions want hockey games to be won by "team-first" approach rather than gimmicky overtimes or shootouts.
For now, the three numbers in the NHL team records are here to stay displayed as Wins-Regulation Losses-Overtime Losses.
The newest generation of fans are now accustomed to the record format.


")

")
