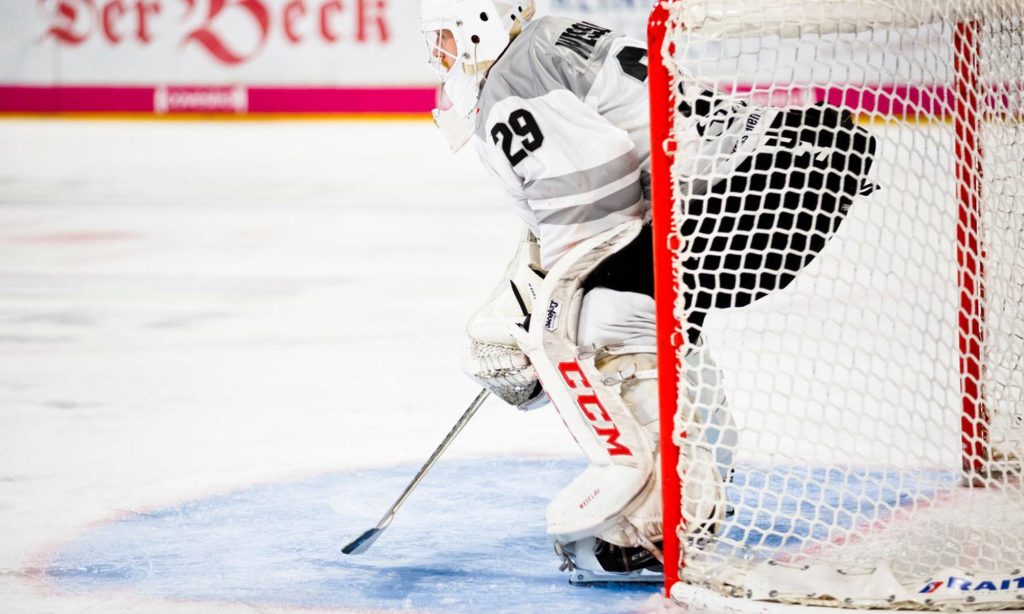
The Save Percentage is a hockey statistic that measures the number of saves a goaltender makes relative to the total number of shots faced.
It can be monitored on a per game basis or calculated cumulatively during the season for each goalie. You can also see the stat listed in a goaltender’s career summary, under the SV% column.
To calculate the save percentage, simply divide the number of saves by the amount total shots faced by the goaltender.
Save Percentage Calculation
Saves / Shots Against = Save Percentage (SV%)
Example: 27 saves / 30 shots = 0.900 SV%
What is the Average Save Percentage in the NHL?
The average save percentage for NHL goalies was 0.910 (or 91.0 percent) during the 2018-19 season. Most NHL starting goaltenders maintain a 0.900 percentage throughout the season at the very least. Andrei Vasilevskiy of the Tampa Bay Lightning won the 2019 Vezina Trophy for the NHL’s best goaltender, finishing with a 0.927 save percentage.
A respectable NHL save percentage falls anywhere between 0.900 and 0.920. Anything below 0.900 is generally considered weak, while a value greater than 0.920 is exceptional.
Keep in mind that the save percentage is only one of several stats used to measure a goalie’s level of success.
The other significant stat is their goals against average (or GAA), which illustrates how many goals are scored against them per 60-minute game.
When a goaltender’s goals against average is high (ex: 3.00+), it means they’re being scored on too many times per game.
However, if both the save percentage and goals against average are high, the fault is less on the goalie and more on the team’s inability to prevent shots against.
In other words, the team is allowing way too many shots on net by their opponents.
So, to prove that my theory is correct, I decided to dig a little deeper.
Below, I compared the save percentage stat for goalies of playoff vs non-playoff teams and even separated the starters from the backups.
For the most part, starting goalies played the majority of the games (42+) during the season.
When there wasn’t a clear-cut starter, I selected the goalie that played the most games as the starter instead.
Save Percentage (SV%) for Goaltenders on Playoff Teams
The average save percentage for goalies on playoff teams was 0.914 SV% during the 2018-19 NHL season (source).
Starting goaltenders had a slightly higher average with 0.915 SV%, while the backups maintained a 0.912 SV%.
Furthermore, Ben Bishop (Dallas Stars) had the best save percentage with a 0.934 SV%, while Martin Jones (San Jose Sharks) had the worst with 0.896 SV%.
As a reminder, each were starting goaltenders for their respective teams.
Save Percentage (SV%) for Goaltenders on Non-Playoff Teams
The average save percentage for goalies on non-playoff teams was 0.906 SV%.
What is truly remarkable is that the starting goaltenders had a 0.909 SV% which is slightly below than the starters that did make the playoffs (0.915%).
Amongst all bottom-end starters, Darcy Kuemper (Arizona Coyotes) had an exceptional season with a 0.925 SV% despite missing the playoffs.
On the other hand, Jonathan Quick (Los Angeles Kings) had a disappointing 0.888 SV%.
The overall save percentage for back-up goaltenders on non-playoff teams was 0.902 SV%.

By looking at these stats alone, you can understand why most teams try hard to sign solid back-up goaltenders anywhere before season start and the trade deadline (in February).
The back-up allows the starting goaltender to rest more often, while helping their team secure more wins.
This is especially important when teams play on back-to-back days, so that the starter doesn’t get worn down mid-season.
But there are certainly other factors that we can look at.
Goal Differential (NHL Standings)
Given that starting goaltenders on both playoff and non-playoff teams have almost identical save percentages, the problem may lie in the overall team performance.
Remember, that starting goalies play the majority of team games, but some will lose more games than others regardless of their efficiency.
So, despite having a better-than-average save percentage, the team in front of them is likely scoring less than the opposition.
We can actually verify this by looking at the NHL standings - more specifically, the goal differential column (DIFF).
If you want to learn more about DIFF stat and its role in determining team standings, make sure to check out my blog post here.
When looking back at all the teams that missed the playoffs in 2018-19, only the Montreal Canadiens outscored their opponents throughout the season (source).
.
In other words, 14 of the 15 non-playoff teams had a negative goal differential when the season ended.
Here’s what it likely meant for a team like the Arizona Coyotes, who’s starter, Darcy Kuemper played 55 games and had an 0.925 SV%.
Even if the goalie were to save all but one or two shots in a game, there is no guarantee they would help the team to victory.
That’s because the final score for those particular games could have ended in 1-0 or 2-1 losses to the opposition.
Throw in the below average save percentages from the back-up goaltenders, and suddenly your team cannot overcome the collection of losses to secure a playoff berth.
Final Thoughts
NHL teams expect their goalies to give their teams a fighting chance to win every game.
The more a team accumulates wins, the better their chances of making the playoffs and a shot at winning the Stanley Cup.
As mentioned earlier, the average save percentage for goalies in the 2018-19 NHL season was 0.910 SV%. This includes both starting and back-up goalies for every team.
Starting goaltenders on playoff-contending teams averaged a 0.915 SV%, while their back-ups brought in a 0.912 SV%. Their combined average was 0.914 SV%.
Anytime an NHL goaltender averages over a 0.920 SV%, it’s considered exceptional – especially coming from your starter.
But this achievement alone will not guarantee your team a playoff berth.
The team needs to compliment a high save percentage with offensive scoring and ice a back-up that can deliver a reasonable save percentage too (around the average - 0.910 SV%).
Furthermore, anytime your starting goaltender averages less than 0.900 SV%, it is generally considered bad.
This is especially true for the back-up goalies and why their NHL careers can be short-lived.
Teams will hold their back-up goalies accountable if their save percentage is below 0.900 SV%, while the starter maintains a reasonably good one (ex: 0.910+ SV%).
Lastly, I would like to point out that scoring reached an all-time record high for the 2018-19 NHL Season.
If you would like to read about an in-depth analysis of how all the goals were scored during the 2018-19 season, make sure to check out my blog post here.
But despite the increase in goals, the save percentage has stayed relatively consistent in the last decade.
The average save percentage since the 2010-11 season is 0.913 SV%.


")

