In today’s game of baseball, advanced analytics is a major component in evaluating individual player skills.
This especially holds true for pitchers as they are central to the team’s defensive strategy.
Historically, management and sports pundits alike would look at the pitcher’s win-loss record, strikeout count, and ERA (earned run average) determine their effectiveness.
But expanded stats help us dive a little deeper.
I’m talking about advance elements such as QS, runners LOB% and WHIP. Let me define these in further detail.
QS is short for Quality Starts, in which starting pitchers allow three or less runs in a game in which they pitched 6+ innings.
LOB% or Left on base percentage is how often a pitcher strands the opposing baserunners on base at inning’s end.
There is a strong correlation between LOB% and WHIP, but WHIP has a function of its own.
Let’s look into it…
What does WHIP mean in baseball?
WHIP stands for Walks plus Hits per Inning Pitched in baseball. The stat is used to measure a pitcher's effectiveness in preventing runners from reaching base. For example, a WHIP of 1.00 means that the pitcher allowed an average of one base runners per inning pitched. WHIP values of 1.00 or less are considered great.
WHIP scores play a vital role in pitcher efficiency.
The less players reach base from walks and hits, the lower their pitch count per inning.
This reduces the load on their pitching arm, while keeping the opposing team run count low over the long term.
As a result, your team will need to rely less on their bullpen and keep all the pitchers in top form throughout the season.
While a team can rectify a poor WHIP score with subsequent putouts, the goal is for the coaching staff to improve their pitcher’s WHIP score over time.
A pitcher with high WHIP score and solid win-loss record is probably an indication that his teammates are carrying him defensively.
It’s a problem that can get exposed during the World Series, especially when facing stronger teams.
Keep that WHIP count in check, otherwise you’re looking at a short-lived career in the pros.
How do you calculate WHIP?
In short, it is the total amount of walks and hits allowed by the pitcher over innings pitched in a game.
The formula is as follows:
WHIP = (BB + Hits)/IP
For example, if a pitcher allowed 3 walks and 6 hits in seven innings played, their WHIP would be:
WHIP = (3 + 6)/7
WHIP = 9/7
WHIP = 1.29
Based on Fan Graphs, the average pitcher WHIP usually falls at the 1.30 mark.
Keep in mind that WHIP numbers can vary from year-to-year, and the range is based on historic values.
The following table gives you an insight of how a pitcher is doing for the season.
WHIP Score for Pitchers
| Rating | WHIP |
|---|---|
| Excellent | 1.00 or less |
| Good | 1.10 |
| Above Average | 1.20 |
| Average | 1.30 |
| Below Average | 1.40 |
| Bad | 1.50 |
| Awful | 1.60 or more |
In 2022, there were 10 pitchers that managed a WHIP score below 1.00.
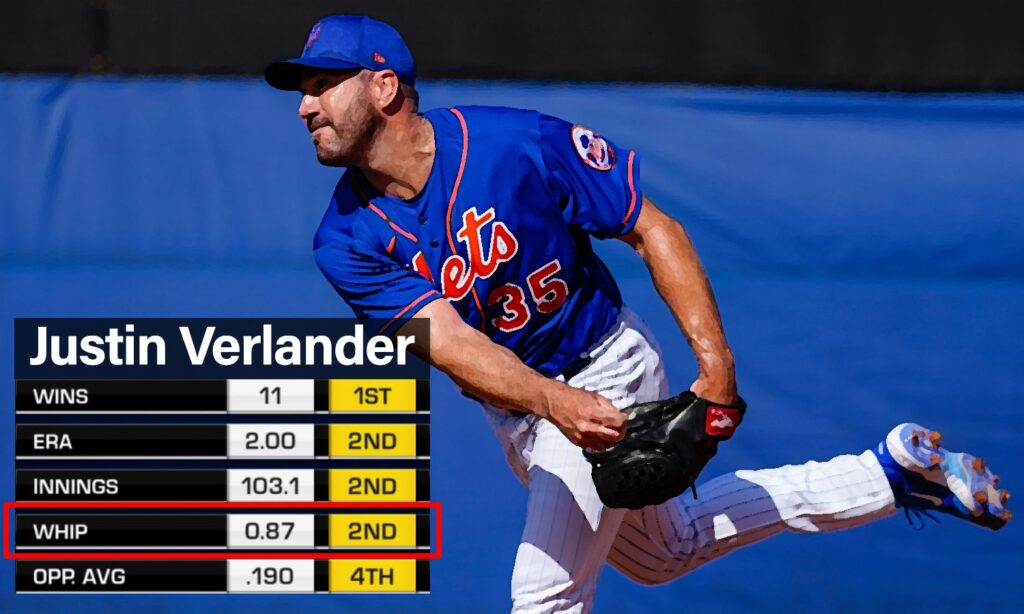
The player that led the league with the lowest score was none other than Justin Verlander of the New York Mets.
He finished the year with a 0.83 WHIP score, the best season in his career thus far.
While not on the list below, Verlander is in the top 25 of career WHIP leaders.
Lowest WHIP scores in MLB History
As you can imagine, the pitchers with low WHIP counts are some of the most popular pitchers of all-time.
The logic is quite simple.
As a pitcher, the more you keep the opposition from reaching base, the better your at winning the game.
While not all low WHIP scores guarantee a team win, limiting the amount of baserunners each inning will pay dividends over the long run.
That said, let’s take a look at the pitchers with the best career WHIP scores in the game:
MLB Record for Lowest WHIP Scores
| Pitcher Name | WHIP Value | Win-Loss Record | |
|---|---|---|---|
| 1 | Addie Joss | 0.97 | 160-97 |
| 2 | Ed Walsh | 1.00 | 195-126 |
| 3 | Clayton Kershaw | 1.00 | 203-90 |
| 4 | John Ward | 1.04 | 164-102 |
| 5 | Pedro Martinez | 1.05 | 219-100 |
| 6 | Christy Mathewson | 1.06 | 373-188 |
| 7 | Walter Johnson | 1.06 | 417-279 |
| 8 | Mordecai Brown | 1.07 | 239-130 |
| 9 | Max Scherzer | 1.08 | 204-104 |
| 10 | Tommy Bond | 1.09 | 193-115 |
Final Thoughts
The WHIP score is fantastic tool to evaluate pitchers on an individual basis.
A low the WHIP score reflects a strong winning percentage, especially for starting pitchers.
While career highs in strikeouts get all the attention, it’s important to pay homage to the pitchers that simply get things done.
I wasn’t as familiar with the top 10 names for career WHIPs as I was for the list in total strikeouts.
The best pitchers that come to mind include Nolan Ryan, Roger Clemens and Randy Johnson.
In fairness, these were the pitchers I grew up watching as a kid.
While they had very respectable WHIP scores, they mostly fell in the “Good” and “Above Average” category highlighted in the chart above.
So, hats off to the pitchers that kept their opponents at bay without the glam and flashiness as some of their peers.
")
")

")
")
