When it comes to hitting in baseball, fans are accustomed to seeing 3 stats displayed on the screen for every player.
The stats I’m speaking of are their batting average, homeruns and RBIs.
Homeruns and RBIs gives you a sense of the player’s power and score contribution.
The batting average gives you an idea of their hitting success over the course of the season. When they’re hovering at a 0.300 AVG, you’re looking at a reliant hitter.
But batting stats are not limited to these three categories. There is an extended set of stats to measure their efficiency at-bat.
One, in particular, is labeled as OPS in the official Major League Baseball stats for hitting.
Before we continue, let’s define OPS…
What does OPS mean in Baseball?
OPS is an acronym for On-base Plus Slugging in baseball. The stat measures a player's overall offensive performance by adding their on-base and slugging percentages. The idea behind OPS is to give equal weight to a player's ability to get on base by any means and their ability to hit for power.
To further elaborate, the on-base percentage (OBP) is related to a batter’s frequency to get on-base relative to their opportunities at-bat.
The OBP takes all hits, walks and hit-by-pitch into consideration. And whether players hit a homerun or get walked, they are equal in weight for measuring on-base percentage.
Meanwhile, the slugging percentage is slightly different.
To begin with, walks and hit-by-pitch are removed from the equation. We are strictly looking at the player’s ability to hit the ball.
Furthermore, each type of hit is not treated equally. If a player hits a single, their slugging percentage (SLG) for the at-bat is 1.000.
Should they hit a homerun, their SLG for this effort is 4.000, because they touched four bases for the one at-bat.
Any out on the play, whether a strikeout, pop fly, line drive, ground out or any other way will result in a 0.000 SLG.
As you probably have figured out on your own, the players with the best slugging percentages are your power hitters.
The more homeruns hit, the more your SLG percentage increases proportionally by 4.000.
For more details on Slugging Percentage and the top 10 sluggers of all-time, make sure to check out my post here.
What is a good OPS in Baseball?
While every MLB season is different, players who average a 0.900 OPS or more is considered good.
Even hitters hovering between 0.800 and 0.900 are considered above average.
Based on Fan Graphs, the average batter OPS usually falls at the 0.710 mark.
Keep in mind that OPS numbers can vary from year-to-year, and the range is based on historic values.
The following table gives you an insight of how a hitter is doing for the season.
TABLE – OPS Score for Hitters
| Rating | Batter OPS |
|---|---|
| Excellent | 1.000 or more |
| Good | 0.900 |
| Above Average | 0.800 |
| Average | 0.710 |
| Below Average | 0.670 |
| Bad | 0.600 |
| Awful | 0.570 or less |
Highest On-Base plus Slugging Percentage
The highest OPS any player can earn at-bat is a 5.000, in which they hit a homerun.
To break it down, the best possible on-base percentage can be 1.000, while for slugging percentage that value is 4.000.
In reality, there is no player that will consistently hit a homerun each at-bat, let alone reach base each time.
Players are going to strike out, ground out, pop out – you name it.
To date, the record for the highest season OPS belongs to Barry Bonds in 2004.
That year, Bonds maintained an on-base and slugging percentage of 0.609 and 0.812 respectively. These values combined resulted in an OPS of 1.421.
Career-wise, Babe Ruth is the all-time leader with a 1.164 OPS. But Bonds was not too far behind as listed below.
Top 10 MLB Career OPS
| Player Name | Career OPS | |
|---|---|---|
| 1 | Babe Ruth | 1.164 |
| 2 | Ted Williams | 1.116 |
| 3 | Lou Gehrig | 1.079 |
| 4 | Barry Bonds | 1.051 |
| 5 | Jimmie Foxx | 1.037 |
| 6 | Hank Greenberg | 1.017 |
| 7 | Rogers Hornsby | 1.011 |
| 8 | Mike Trout | 0.998 |
| 9 | Manny Ramirez | 0.996 |
| 10 | Mark McGwire | 0.982 |
How to Calculate OPS
On-base plus Slugging percentage is quite literally the sum of the OBP and SLG values:
OPS = OBP + SLG
All three values appear in the MLB stats page, which you can see here.
So, to determine the OPS value based on raw stats, you’ll need to apply the following formulas:
OBP = (H + BB + HBP)/(AB+BB+HBP+SF)
SLG = [(1B) + (2 x 2B) + (3 x 3B) + (4 x HR)] /AB
Below is the full description for the acronyms:
BB - Walks (base on balls)
HBP - Hit-by-Pitch (Expanded MLB Stats)
AB - Player At-Bats
SF - Sacrifice Fly (Expanded MLB Stats)
H - Hits
2B - Doubles
3B - Triples
HR - Homeruns
Example:
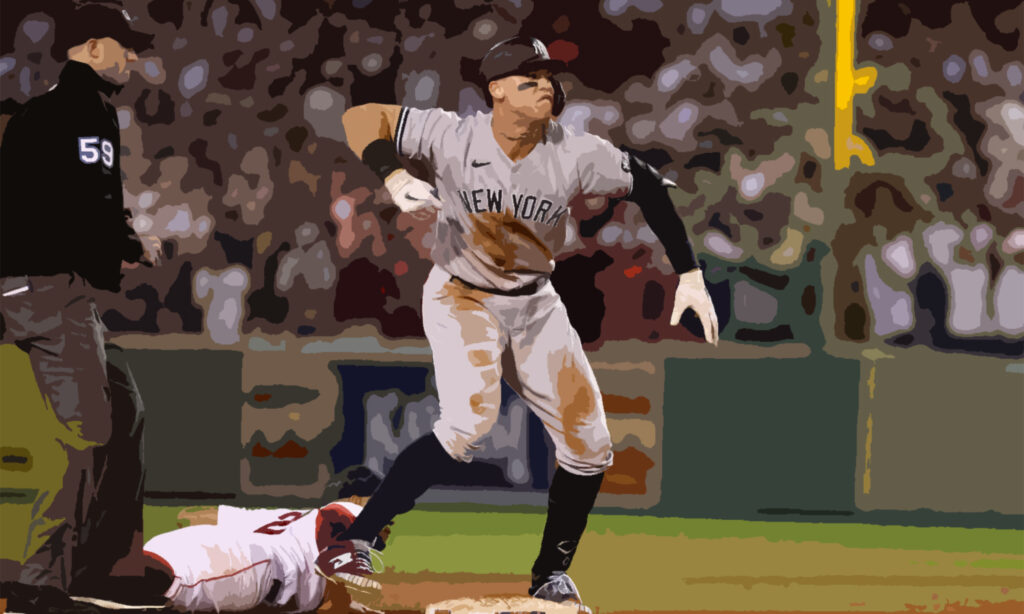
We’re going to use Aaron Judge stats in 2022 for our OPS calculation, which should match his listed OPS of 1.111.
For his OBP, Judge’s individual totals were:
H - 177
BB - 111
HBP - 6
AB - 570
SF – 5
OBP = (H + BB + HBP)/(AB+BB+HBP+SF)
OBP = (177 + 111 + 6)/(570 + 111 + 6 + 5)
OBP = 294/692
OBP = 0.425 or .425
For his SLG percentage, Judge’s individual totals were:
AB - 570
H - 177
2B - 28
3B - 0
HR – 62
His Singles count was:
1B = H – 2B – 3B – HR
1B = 177 – 28 – 0 – 62 = 87
SLG = [(1B) + (2 x 2B) + (3 x 3B) + (4 x HR)] /AB
SLG = [(87) + (2 x 28) + (3 x 0) + (4 x 62)/ 570
SLG = [87 + 56 + 0 + 248] / 570
SLG = 0.686 or .686
Combined, the OBP and SLG values amount to 1.111, as expected.
Final Thoughts
The On-base plus Slugging percentage is an overall fantastic way to find the power and efficiency of your batter.
It’s one thing to have a power hitter on your team that can hit homeruns regularly.
It’s another thing when your power hitter gets on-base frequently when at-bat.
Not only are they a threat for hitting homeruns, but they will also hit doubles, triples, force walks and ultimately cause panic to the pitcher.
These types of batters contribute to offense in every which way.
Furthermore, they are less likely to be jinxed by streakiness. The last thing you want is for your hitter to go on a strikeout or hitless binge.
At that point, your prime hitter goes from hero to the weakest link.
When a player can will their way to base, the team doesn’t have to worry about the player suffering from a mental lapse.
It’s possible they go on a homerun dry spell, but that may be more due to variance rather than a psychological breakdown.
And as illustrated in the top 10 OBP players of all-time, these are players that were there for the team day-in and day-out.
